![]() By:Lars Engvik
By:Lars Engvik
The tribology paradox, have you ever heard about it?
Honestly, I had not heard about it either until I started digging through various scientific reports and presentations.
The tribology paradox describes the fact that the total amount of energy or fuel that may be saved by reducing friction in a passenger car is higher than the amount of energy saved if looking at the reduced friction in isolation.
If this doesn’t make any sense keep on reading and I will try to explain in a short while.
The purpose of energyfaculty.com is to contribute to increased knowledge and learning related to energy by providing information, data, formulas and tools such that you may make your own considerations.
In the following I will attempt to address and explain one often neglected element of the energy debate.
This post is the first in a series of articles where we will be addressing energy efficiency.
So, in this post the topic is Friction and how this affects the energy efficiency of passenger cars.
I was for sure surprised to see what amounts of energy that is “wasted” to overcome friction.
And even more surprised to see how much energy that actually could be saved if we get better in managing friction.
Please read on.
If you have views or insight on this subject leave a comment at the bottom of this post.
If you believe other people might find this useful please share.
Scientific research
A lot of research to learn more about friction is carried out.
An example of such research is some of the work done by The Finnish joint industrial consortium strategic research action, coordinated by FIMECC Ltd. Their researchers have done a lot including preparing white papers, reports and presentations on how energy is wasted in overcoming friction.
The report “Global Impact of Friction on Energy Consumption, Economy and Environment”
Has been prepared by Kenneth Holmberg, Research Professor VTT Technical Research Centre of Finland and Ali Erdemir, Distinguished Fellow Argonne National Laboratory, USA.
At the bottom you can find a full reference list indicating sources of information used when preparing this post.
How much energy is wasted every year in transportation to overcome friction?
Almost one fifth of all the primary energy supplied globally in one year is used to overcome friction.
The main areas where this energy is used are transportation, general industry, energy industry and residential and services sectors.
What is primary energy?
Primary energy is found in nature and has not been subject to conversion or transformation. Primary energy can be renewable or non-renewable.
It is estimated that more than 100 exajoule (EJ) is used every year to overcome friction
100 EJ ≈ 100 million terajoule (TJ) ≈ 278 million Megawatt hours (MWh)
2388 Mtoe ≈ 17500 million barrels of oil equivalents (Mboe)
4326 Mtoe ≈ 32000 million barrels of oil equivalents (Mboe)
This is around 18% of the total global energy supply. In statistical terms this is called Total Primary Energy Supply (TPES).For comparison this represents the same amount of energy as:
2388 Million tons of oil equivalents (Mtoe)
According to IEA the annual global oil production in 2015 was 4326 Mtoe. IEA is the International Energy Agency:
“IEA works to ensure reliable, affordable and clean energy for its 30 member countries and beyond. Our mission is guided by four main areas of focus: energy security, economic development, environmental awareness and engagement worldwide”.
So, the amount of energy spent on overcoming friction every year represents more than half of the energy content of all global oil production.
Of course, not all energy used to overcome friction, actually come from oil, but it demonstrates the amount of energy “wasted”.
Wear and damages
In total around 16 exajoule (EJ) per year is used for remanufacturing and repairs due to friction.
In addition to the energy used to overcome friction, friction also is the direct or indirect cause of significant wear and damages to equipment and machinery.
Energy is also consumed in the process of remanufacturing or making repairs.
Energy wasted in transportation
571 exajoule (EJ) ≈ 13635 million tons of oil equivalents (Mtoe)
Transmission losses in energy generation ≈ 178 exajoule (EJ)
Total final Consumption (TFC) ≈ 393 exajoule (EJ) or 9385 Mtoe
The total primary energy supply in 2015 was according to IEA around 571 exajoule (EJ).
One third of this energy was consumed by the energy industry in power plants for energy generation and as transmission losses.
Leaving only 2 thirds of the original energy for consumption, total final consumption (TFC).
Out of the remaining energy available for consumption, around 28% were used in transportation.
29% were used by other industry and another 43% were mainly consumed within household, services and for non-energy use.
Energy is used in all sectors of transportation to overcome friction, including passenger cars, buses, trucks and trains, shipping and aviation.
It is estimated that the energy used globally to overcome friction in passenger cars is around 11,2 exajoule (EJ).
11,2 EJ ≈ 252 Megaton fuel
The composition of the fuel is 70% gasoline and 30% diesel
For,
- Vans, pickups and SUVs it is 4,6 EJ
- Heavier trucks and trailers 4.9 EJ
- Buses and coaches it is 1.3 EJ
The 11,2 EJ used to overcome friction in passenger cars represents around 327,000 million litre of gasoline and diesel.
Combustion of this fuel causes emission of 787 Megatons of CO2.
How energy is wasted in passenger cars.
Friction occurs where one surface slide or rotate against another surface with or without lubrication present.
That would typically be within bearings and gearboxes, camshafts and valve stems as well as between pistons and cylinder walls.
Despite a lot of research in many sectors and even if progress and improvements have been made in developing new materials, improved lubrication and better design, the amount of energy spent to overcome friction is still huge.
Bear in mind that friction is not only a problem, it is also absolutely necessary for us to function normally.
Without friction there would be no traction and all movement would be very hard to control.
Even if these numbers mainly are global averages representing a cross section of all the 700 million passenger cars world wide we believe that the numbers still provide a fairly good overall picture.
Bear in mind that if you are looking at performance data for specific car models you might find considerable deviations from the numbers provided here due to differences in vehicle and motor make and type, mileage and age.
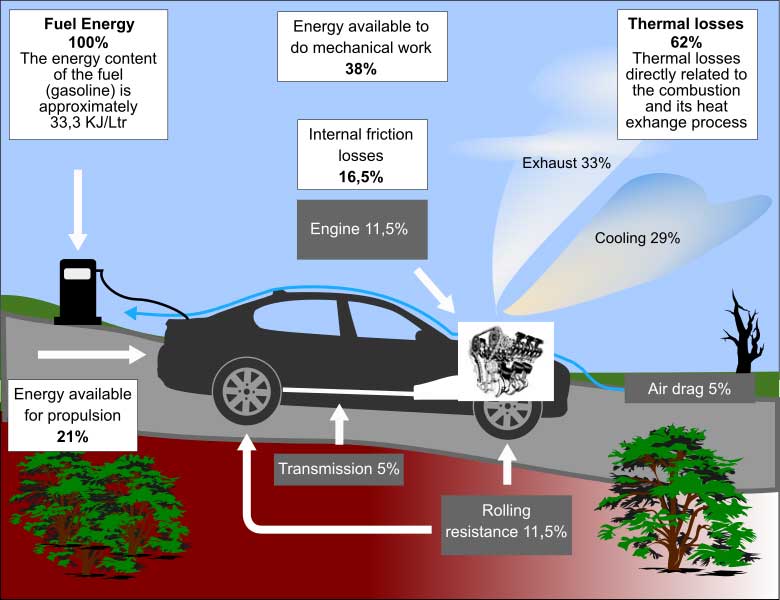
Thermal energy losses ~ 62%
- Exhaust ~ 33%
- Cooling ~ 29%
Mechanical power ~ 38% available to do work
- Frictional losses ~ 33%
- Air drag ~ 5%
Frictional losses
- Engine ~ 11,5%
- Transmission ~ 5%
- Rolling resistance/- friction ~ 11,5%
- Braking ~ 5% (Here we assume this to be the same amount of energy that is used for accelerating the car)
Around 62% of the fuel energy in an automotive internal combustion engine is transformed into thermal losses directly related to the exchange of heat from the combustion process, while the rest of the energy is transformed into mechanical power.
The heat generated from the combustion process is typically exchanged with the surroundings via the cooling water and then to the air through the radiator and via the exhaust gases through the tail pipe.
Internal friction also generates heat, this heat is transferred directly to the surrounding air or via the cooling system.
Mechanical power available to do work after the thermal losses represent 38% of the fuel energy.
From these 38%;
11,5 % of the energy is used to overcome friction within the engine and 5% within the transmission.
That leaves 21,5 % of the fuel energy for moving the car, whereas 11,5 % is used to overcome rolling resistance and the remaining 10% is used to overcome air drag and for accelerating the vehicle. The energy used for accelerating the vehicle is lost when the brakes are used to slow down the speed.
Adding up the numbers, it means that a total of 33% of the fuel energy is used to overcome friction.
- 16,5% – engine and transmission
- 11,5% – rolling resistance (Note that the major friction element of rolling resistance is hysteresis losses)
- 5% – This is the energy used to accelerate the vehicle being lost when using the brakes to reduce the speed.
Friction causing losses in the engine and transmission mainly occur between shafts and bearings, inside roller bearings and between the cylinder wall liners and the piston rings and skirt.
Main friction zones in an Internal Combustion Engine (ICE):
- Crankshaft bearings
- Connection rod bearings.
- Cam shaft bearings
- Piston rod bearings
Rocker arm bearings, rocker arm or cam profile against valve stems also contribute to the friction losses within an internal combustion engine.
Gearbox bearings, the contact between gears also are areas where friction losses occur.
Since an automotive internal combustion engine is a reciprocating machine there are certain challenges related to ensuring sufficient and stable lubrication.
Even if the cylinder walls and the pistons are lubricated with oil sprayed from the underside of the pistons, the sliding movement against the cylinder wall liners is a cause of substantial friction.
Pistons or actually the piston rings and the piston skirts moves at a high speed against the cylinder wall liners.The pistons and the piston rings are subject to high pressure and temperature from compression and combustion.
Mean piston speed for passenger cars would normally be in the range of 14m/s – 25m/s (The higher range is for sport vehicles and motor bikes).
The high speed movement in combination with strong forces and high temperatures acting on the pistons will occasionally break the lubrication film. When the lubrication film is broken the result is eventually metal to metal contact that will cause excessive friction and potential damage to the cylinder walls and the piston rings.
Another possible consequence of wear caused by friction between cylinder wall liners and pistons is reduced compression ratio.
Worn or damaged cylinder wall liners and piston rings may cause excessive leakage of fuel gases and combustion gases into the crank case, therefore lower compression. This may affect the energy efficiency as well as having a negative effect on emissions of unburnt hydrocarbons and particles to the atmosphere.

Diesel engines versus gasoline engines
Due to its higher compression ratio a diesel engine has higher thermal efficiency compared to a gasoline engine. If as far as possible comparing like for likes a diesel engine compared to a gasoline engine also have a lower fuel consumption due to the higher thermal efficiency but also due to the higher energy content of diesel fuel per volume unit.
As already indicated the numbers presented are global averages not identifying the differences but taking the differences into account. I will therefore not go into any more detail of the differences between diesel and gasoline pasenger cars in this post but will adress this more thoroughly in a laters post on engine and car efficiencies.
The friction losses in a diesel engines are regarded similar or a little higher compared to those of a gasoline engine.
Just to be clear, when I am using the term diesel or gasoline engine or car what i actually mean is engines using diesel or gasoline as fuel, which again have a more scientifically correct description as the Otto cycle (gasoline) and the Diesel cycle.
How friction losses in passenger cars can be reduced.
There are various approaches to reducing friction losses affecting a road vehicle, some of them are:
- Improving the mechanical properties by improved design of bearings, shafts, gears, cylinders and pistons
- Use of low friction materials and alloys
- Improved lubrication oil and lubrication systems
- Use of friction reducing and surface enhancing coatings and additives
- Improved tyres with low rolling resistance.
Example of possible energy saving:
If the internal friction of the engine and driveline of passenger cars on average is reduced by say, 30%, the total global fuel consumption would be reduced by 129,000 million litres per year, which is 13% reduction, corresponding to a global reduction of 311 Megatons (Mt) of CO2 to the atmosphere every year.
If we could reduce all the friction losses by the same 30%, the total global fuel consumption would be reduced by 258,000 million litres per year, which is 26% reduction, corresponding to a global reduction of 620 Megatons (Mt) of CO2 to the atmosphere every year.
Tribology scientists and other experts have estimated that it would be possible to reduce friction in passenger cars by 18% on a short term basis and 37% on a long term basis and even as high as 61% if more research is carried out and the most advanced solutions are implemented on a broad basis.
The tribology paradox
The tribology paradox describes a phenomen where the total reduction in energy need or fuel consumption due to less friction is larger than the energy used to overcome the same amount of friction.
The reason being that when friction is reduced, the total amount of energy needed is reduced and as a consequence the thermal losses are reduced too.
Remember, the thermal losses are directly related to the amount of fuel being burned and the heat generated in the cylinders.
Let me try to explain by an example:
If we use the 30% reduction in internal friction as in the example above the reduced amount of energy needed as a direct consequence of less friction is 3,92 EJ.
With less friction, the need for energy or power to rotate the engine and the drive train also is less and therefore we need to burn less fuel. When less fuel is burned the thermal losses are reduced, hence the total losses are reduced not by 3,92 EJ as the reduced friction isolated would imply but it is actually reduced by 4,42 EJ, when taking into account the reduced thermal losses. This reduction represents 129,000 million litres of fuel.
(The energy and fuel calculations are based on a lower (LHW) heating value for gasoline of 44,400 KJ/Kg or 33,300 KJ/ltr fuel and a density of 0,75 kg/ltr and 43,400 KJ/Kg or 36,450 KJ/Ltr and 0,84 kg/ltr for diesel).
To put things into perspective.
- ☞ USA consume 1415 million litres of gasoline every day which is about 4,39 ltr gasoline per day per capita.
- ☞ Norway consume 3.3 million litres of gasoline every day which is about 0,73 ltr gasoline per day per capita.
- ☞ Germany 47.7 million litres of gasoline every day which is about 0,84 ltr gasoline per day per capita.
- ☞ China 304 million litres of gasoline every day which is about 0,22 ltr of gasoline per day per capita.
- ☞ India 67 million litres of gasoline every day which is about 0,05 ltr of gasoline per day per capita.
- ☞ Bangladesh 1.6 million litres of gasoline every day which is about 0,05 ltr of gasoline per day per capita.
5 tips on how to keep friction low in passenger cars
There are a few things we can do ourselves to contribute to keeping friction low in our passenger cars:
- We can make sure we or our service garage use the engine and gear oil with the best friction properties
- We can make sure that oil change and lubrication is performed at recommended intervals
- We can invest in and use friction reducing coatings and additives (Nanotechnology)
- We can make sure we use tyres with optimum rolling properties (Might often be a trade off with driving comfort and safety)
- We can make sure we use the recommended tyre pressure.(Higher pressure – lower resistance, this too often is a trade off between driving comfort, safety and service life of the tyres)
Drive pattern
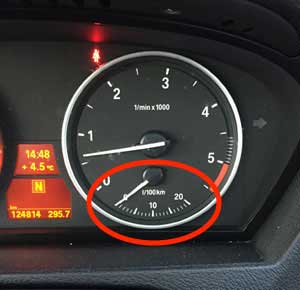
Most modern passenger cars have some sort of meter, warning about the current fuel consumption. Keeping an eye on this meeter while driving and adjusting your driving pattern accordingly could help you keeping the fuel consumption down.
References:
- Influence of tribology on global energy consumption, costs and emissions , 1 VTT Technical Research Centre of Finland, VTT FI-02044, Finland 2 Argonne National Laboratory, Argonne, IL 60439, USA, © The author(s) 2017. This article is published with open access at Springerlink.com
- Global Impact of Friction on Energy Consumption, Economy and Environment, Kenneth Holmberg Research Professor VTT Technical Research Centre of Finland , Ali Erdemir Distinguished Fellow Argonne National Laboratory
- Global energy consumption due to friction in passenger cars, Kenneth Holmberga, Peter Anderssona, and Ali Erdemirb, aVTT Technical Research Centre of Finland, P.O. Box 1000, FI-02044 VTT, Finland bArgonne National Laboratory, Energy Systems Division, 9700 South Cass Avenue, Argonne, IL 60439, USA
- Wikipedia.org
- IEA International energy agency (Key World energy statistics 2017)